Hi everyone!
After a few months without finding the opportunity to play with Gephi, it was already time to dedicate a lab day to this. I thought that a good feature would be having the equivalent .gexf file for the current graph representation available at the tab “GoAnnotation Graph Viz”; so that you could play around with it in Gephi adapting it to your specific needs. Then I got down to work and this is what happened:
First of all I was really happy to see how there was a new version of Gephi (0.8) as well as a good bunch of new (at least for me… :D) layout algorithms plugins available like Parallel Force Atlas, Circular Layout or Layered Layout. So once I have downloaded and installed everything I started to have some fun with it and get to know how filters work, (I haven’t used these ones before). Even though I got stuck a couple of times trying to figure out how to use some of them, I easily solved these small setbacks thanks to the great support found in the Gephi forums, where they quickly answered my newbie questions, thanks Gephi team!
As a source for the graph I used the public EHEC GO annotations we did for the E. coli O104:H4 Genome Analysis Crowdsourcing we coordinated last summer and chose the Molecular Function sub-ontology for the visualization.
When I first loaded the gexf file in Gephi without applying any kind of filters this is what I got:
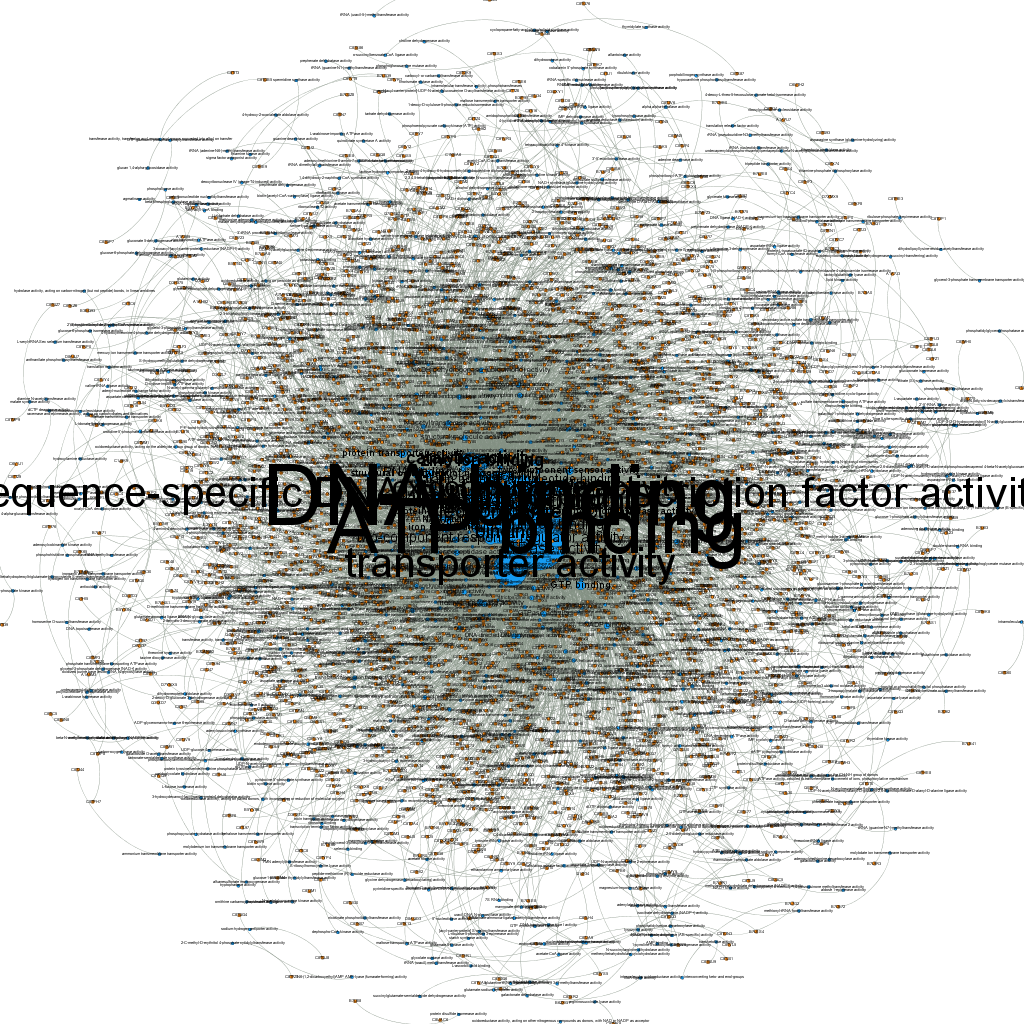
As you (maybe) can see, the size of GO term nodes is proportional to the number of proteins they annotate; still it pretty much looks just like a big hair-ball…
Then I applied the following set of filters:
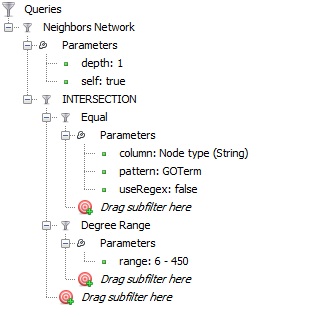
in order to get the GO terms with at least 6 protein annotations plus the proteins which are annotating these terms (their neighborhoods); and this is what it looked like (after applying a Parallel Force Atlas layout algorithm):
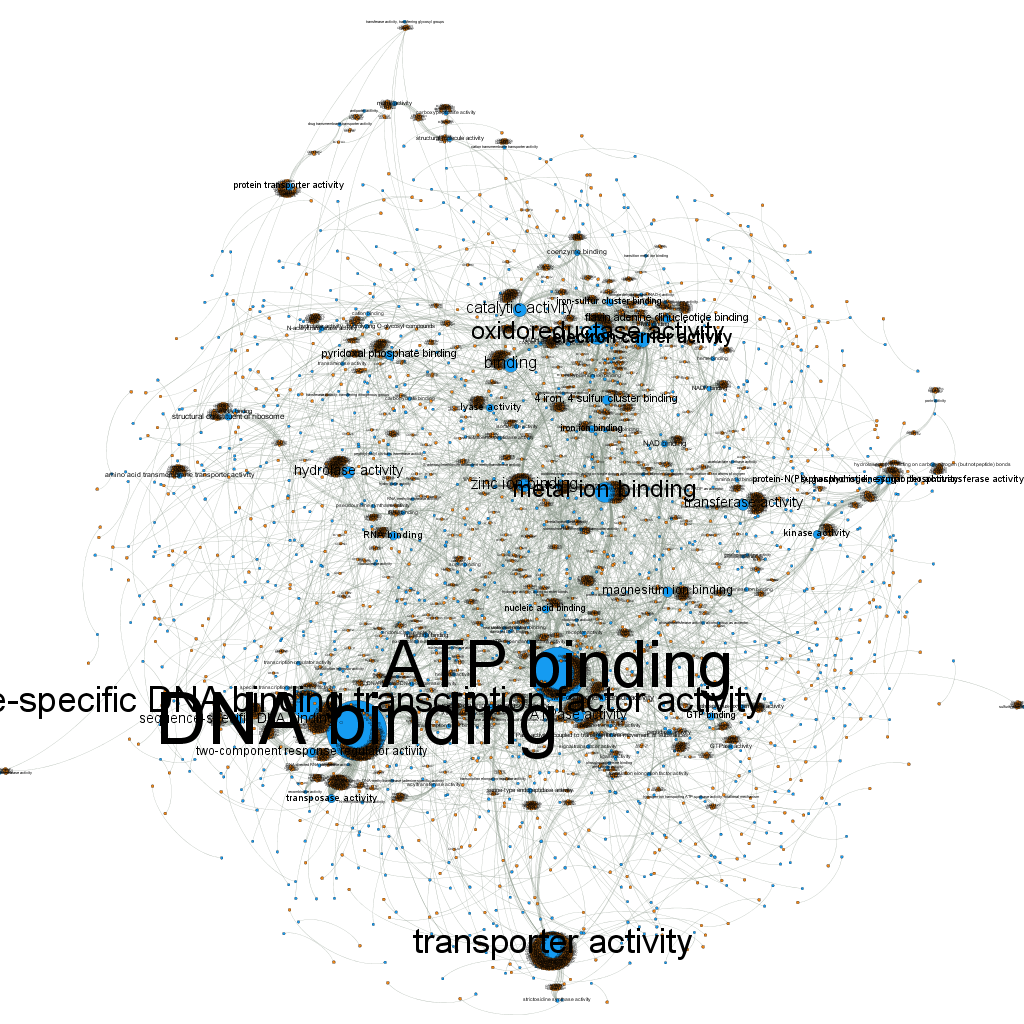
I decided then to get rid of the protein labels, since they were way too many and not so useful to be seen; for that I used the option: “Hide nodes/edges labels if not in filtered graph”. After doing this and applying the black background preview setting, the visualization finally looked pretty decent:
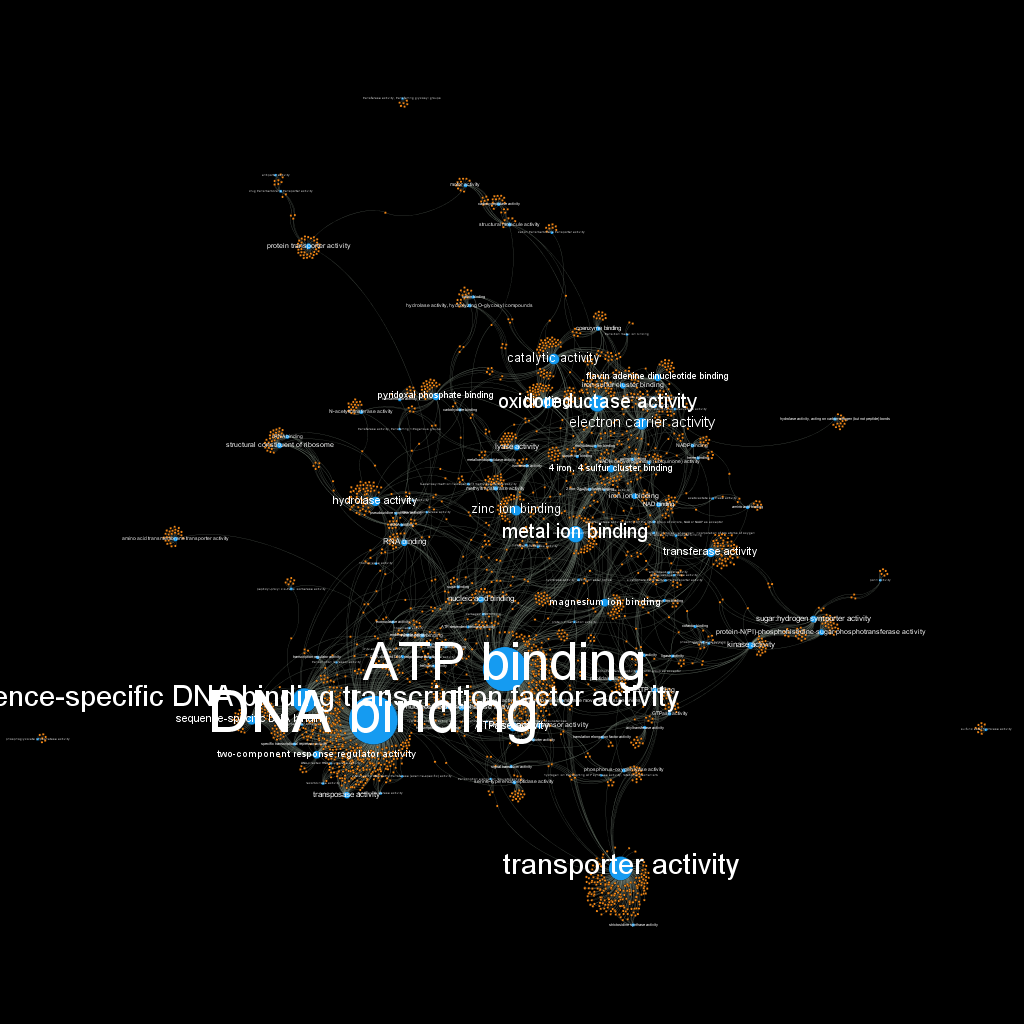
Please go here to check the version exported with Sea Dragon plugin where you can zoom and move around!
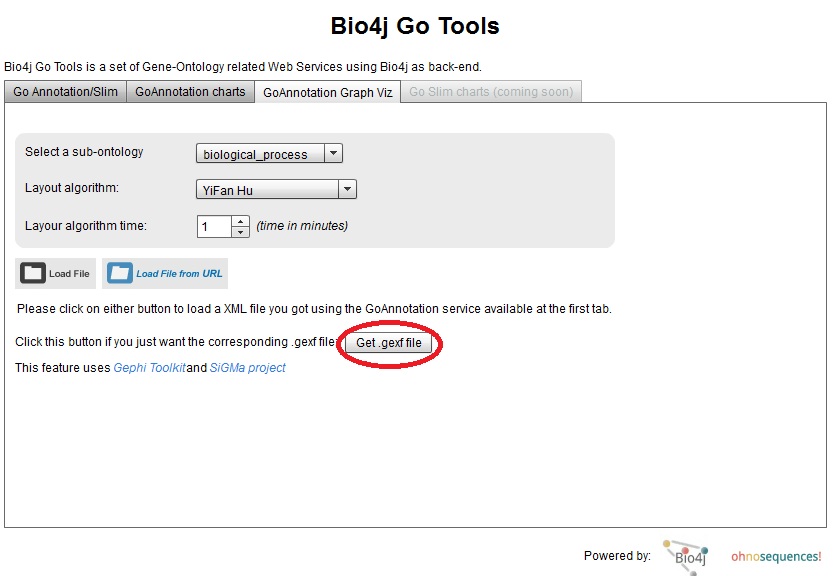
Well, if you like the result (or you don’t but you want to play with this and get a better viz!), I just uploaded a new version of Bio4j GO Tools viewer where you can download the corresponding .gexf file for your GO annotations XML file. Just press the button highlighted in the screenshot and enter the URL for your GO annotations XML file:
You can use the public EHEC GO annotation results URL I used as a sample for this post:
https://s3-eu-west-1.amazonaws.com/pablo-tests/EHECAnnotationVersion2.xml
So, that’s all for now, please let me know if you play around with this and get some cool visualizations!
comments
-
Amrit Good to know it. Does it take expression data also. I have expression data with gene name and probe I’d only. Would you mind to suggest whether it work or not for this kind of data. Thank u so much for your help.
- Pablo Pareja Hi Amrit, There is no restriction for the input data, the only thing is that the tool expects Uniprot accessions as parameters. You would just need to map your gene names to Uniprot accessions using a ID mapping tool such as that available at uniprot website: http://www.uniprot.org/ (ID mapping tab) Cheers, Pablo